1. Introduction
he Internet of Thing (IoT) refers to gathering and sensing data from various apparatus about our daily life corporal phenomena [1,2]. IoT has acquired capacious popularity owing to its extensive market in several sectors such as home automation, healthcare, security, etc. [3]. IoT entangles pervading internet connectivity beyond valuable devices to any province of traditionally daft or non-internet-enabled naturalistic devices and quotidian things [4]. IoT was begotten from machine-to-machine (M2M) interaction. Machines are joining to the objects via a network except for human communication [5].
Real-time is a level of computer compassionate that a customer senses as sufficiently early or that qualify the computer to repose up with several processes (for example, to attendant visualizations of the weather as it incessantly mutations) [6]. Real-time is an epithet regarding computers or processes that handle in real-time. Real-time describes a man rather than an engine sense of time [7].
Real-time computing (RTC) is a period of computing decision that has inelastic instant constraints. Real-time computing must be committed in a time structure that is relatively invisible to the user [8]. A real-time system is any message processing system which must answer to externally propagated input incentive between a limited and specified epoch [9]. If it overcomes this time bondages, it's output in accomplishment erosion and malfunction of the process [10]. Denoting to the data-scheming system in which a computer takes every moment transforming data, such as knowledge relating to air-traffic monitoring, travel booking procedure and processes it practically to be capable of controlling the origin of data [11].
2. a) Characteristics of Real-Time System
? Time Encirclement.
? Modern Rectification Inference.
? Interwoven.
? Security-Criticality.
? Concurrency.
? Allotted and Recompose Formation.
? Ought Troublesome.
? Usage Hardware.
? Durability.
3. II.
4. Background and Related Work
In 1970s Minicomputers specially built for dedicating embedded systems such as DOG scanners, onward the necessity for low-latency priority-driven with accessing data and operating systems suchlike Data General's RDOS (Real-Time Disk Operating System) and RTOS's background and foreground scheduling as Digital Equipment Corporation's RT-11 date from this age. On time when the MOS Technology 6502 and the Motorola 68000 were exoteric relatives could conduct their abode computer as a real-time system. The chance to deactivate several intermissions allowed for hardcoded loops with fixed timing and the less interrupt latency allowed the impersonation of a real-time system [12].
We implemented and modified our system with this two-existing system. In the procedure 1, Smart home regulating devices are using for guiding the systems by sending data to govern the actuators. Here they also used the home gateway for relating all home appliances and interconnected with the Internet on the open network part, and the home networks also control the home machinery. The home gateway gives the ability to control the connected equipment on the home networks that controlled with smart instruments and passed data through the system and collect data for calculating real-time [13]. In the procedure 2, there submitted a low cost secure mobile phone-based home automation system [14,15]. Appliances at home are linking with the Arduino BT board, and the communication within the mobile phone and the Arduino BT board is wireless [16]. Superfluous apparatus can be connected into the system, and it should be faster enough to actualize the power of wireless technology and be cost effective. In this system, they also are measuring data for calculating real-time [17,18].
In our system, we connected all devices with the server and motion sensor for controlling our automation system. We passed data through our implemented process for measuring the time that is needed to turn on/off the equipment. For calculating real-time performance, we implement a virtual system in Cisco Packet Tracer. We use server and motion sensor for connecting the devices. The equipments are light, fan, door, window, sprinkler, webcam and motion detector. The sensor is joining to the SBC-PT Board, which is one kind of networking access board. All equipment attached with the server through a unique IP address. Entering to the server and viewing the activity of the system by home authority there use a laptop. To collect real-time data, we passed packets through the system and putting it to the performance matrices equation for calculating the real-time action of our system. We also build the other two existing methods in Cisco Packet Tracer for comparing our systems performances [19].
5. III.
6. Proposed System a) System Description
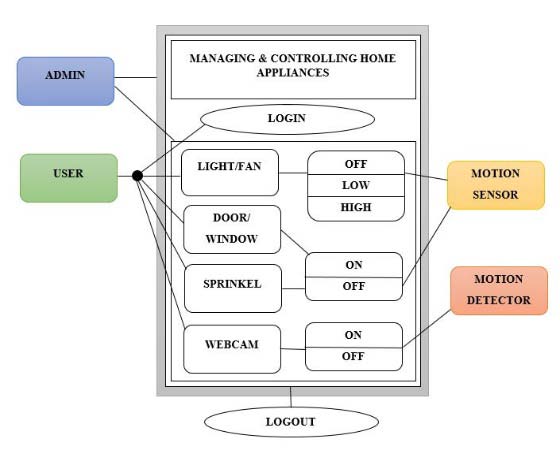
7. b) User Case Diagram
User case provides a path, how the user gets the entrance license of the system. A user cannot straightly access the arsenal so that they needed to exact authentication. Here also we see equipment internally linked with the system action. Use cases are typically induced by a user to meet the goals detail activities and variants inlaid in gaining the aim [20].
8. Flow:
? Admin Managing & Controlling Home Appliances Logout. Admin is the prime controller for managing, measuring and controlling the access of the services.
9. Fig. 2: User Case Diagram
? User Login Using Equipment Logout.
To start using the system, the user must use the login interface to log in into the system. When the user wants to control the equipment, they first log in to the service with their password. If their passwords match, then they get the access. After using the device, they are log Out from the process.
? Ingredient Motion Sensor. Light, Fan, Door, Window, Sprinkle connected to the motion sensor. When the sensor detected any person, then it is automatically on/off. ? Ingredient Motion Detector. Webcam connected to the motion detector. If any person passes through a motion detector, then it is automatically on/off. Therefore, we see the passing passenger.
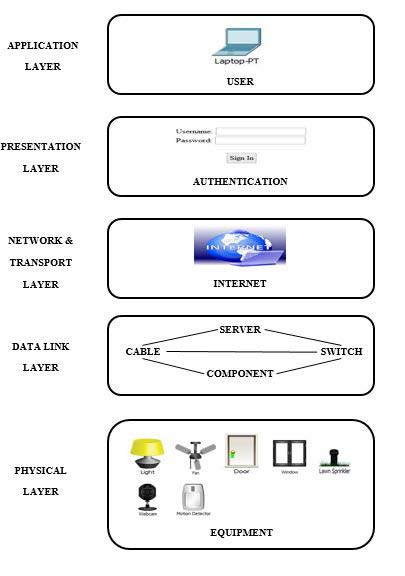
10. c) Layer Development
Layering is the association of programming into individual functional elements that interact in various sequential and hierarchical way, including each layer generally having an interface alone to the layer above and below it [21]. IV.
11. Analysis Of Proposed System a) Data Collection
For calculating real-time, we pass packet through equipment from starting point to end. We pass the packet into two different ways. And the ways are 1) Equipment to server & 2) Server to Equipment. In this process we listed time, some packets are passed that called passing time or true position time. Here true position time denoted as x & y. And some packets are not passed that called obstacle time or false position. We denote false position as x' & y' [22,23]. To calculate real-time, we use six different types of performance metrics. The metrics are Sensitivity, Specificity, Precision, Accuracy, F1-score, G-mean. We can apply all the performance metrics into seven different equipment such as light, fan, door, window, sprinkler, webcam and motion detector. ? G-mean: The G-mean is computing by taking the square average value of sensitivity and specificity.
G-mean =?Sensitivity + Specificity
12. b) Comparison
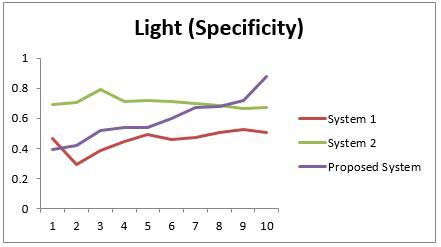
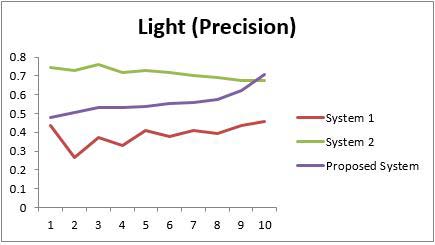
Previously we discussed two different systems. We can also implement these systems and passes packet through that systems for calculating the passing time and obstacle time. With the help of performance metrics, we calculate real-time through this passing time and obstacle time. The Graph for Light (Sensitivity): System 1 goes zigzag, and system 2 goes from high to low but our system goes from low to high. The Graph for Light (Specificity): Our system's specification is better than other two process because it is an up-ordering line. The Graph for Light (Precision):
13. Comparison of Light:
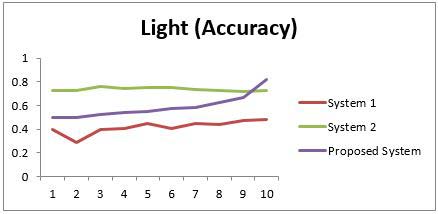
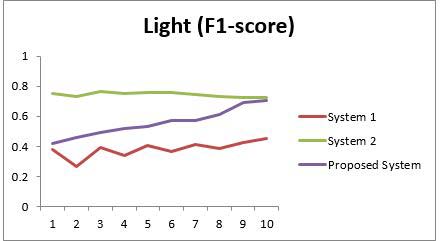
Our system precision is better than other. The Graph for Light (Accuracy): System 1 and system 2 are creating down order line, but our system is high-ordered. The Graph for Light (F1-score):
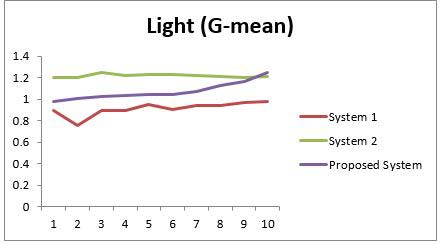
The value of F1-score in our system is excellent than the other two methods. The Graph for Light (G-mean):
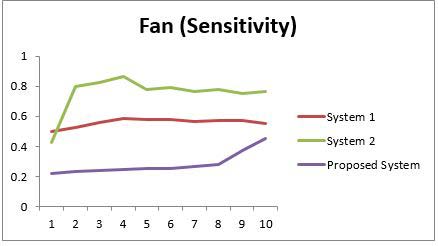
We are measuring the value of three systems and plotting the value for generating the graph line, and line is increasing. The Graph for Fan (Sensitivity):
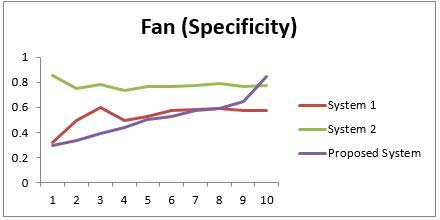
For comparing three systems, we saw that our system's sensitivity is better than others. The Graph for Fan (Specificity):
We collect data and compare with them and saw that the proposed system is proper.
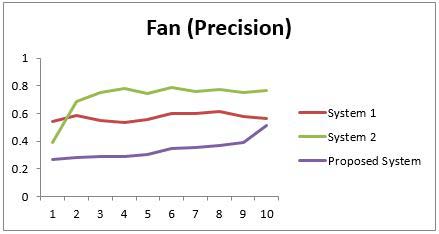
14. The Graph for Fan (Precision):
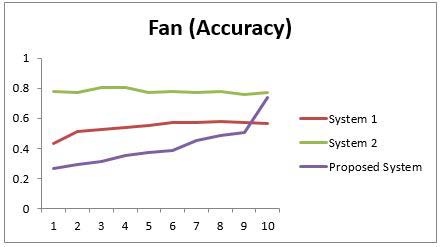
From the table and graph, we predicted that the precision of our system is the best than others. The Graph for Fan (Accuracy): System 1 and 2 is down order line. Our system is emersion, so it is enriching the graph. The Graph for Fan (F1-score):
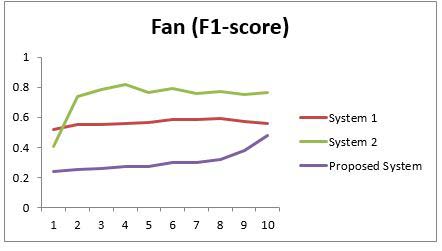
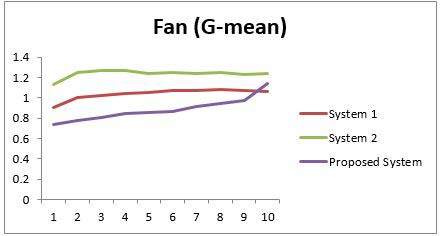
Plotting the value and choose a better system and our system is better than others. The Graph for Fan (G-mean):
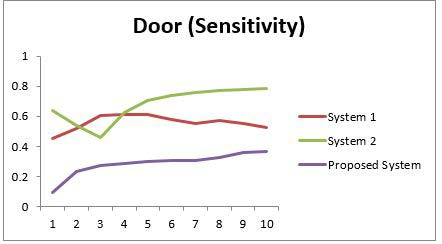
For fan, the G-mean is elder than system 1 and system 2 because it is emergence from others. The Graph for Door (Sensitivity): System 1 rise low to high and low. System 2 is ascent high to low and high. Our system goes low to high without breaking. The Graph for Door (Specificity):
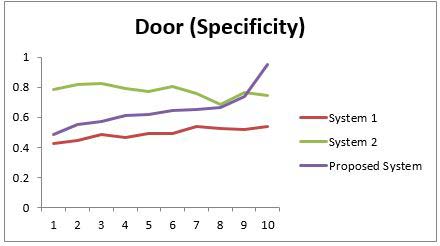
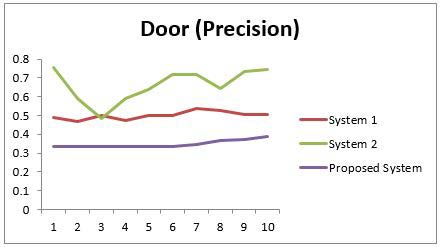
Plotting the value and generate the graph for three system and our system graph is better. The Graph for Door (Precision):
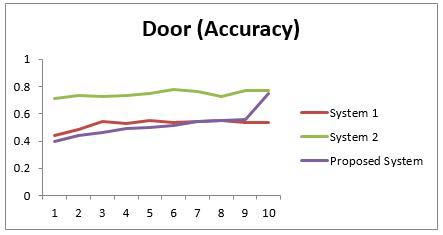
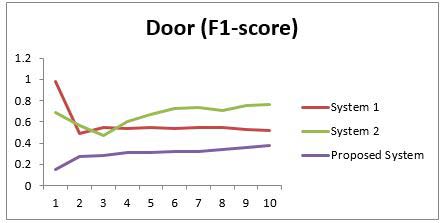
For metering the effect of the specification of fan we collect and compare data for three system and the proposed system is strong. The Graph for Door (Accuracy): System 1 and 2 are devious, and our system's accuracy is the best because it is a rising line. The Graph for Door (F1-score):
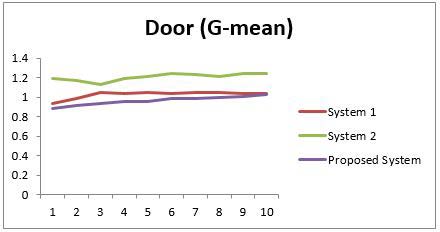
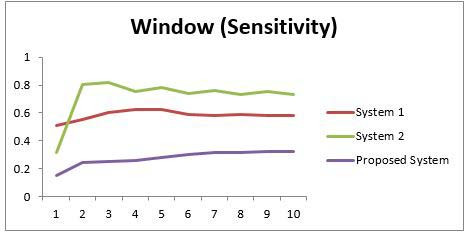
Construct the diagram we saw that system 1 and system 2 are decreasing, and our system is increasing. The Graph for Door (G-mean): Our system's G-mean is elder than system 1 and system 2 because it is emergence from others. From the diagram, we saw that our proposed system sensitivity is good than other systems. The Graph for Window (Specificity):
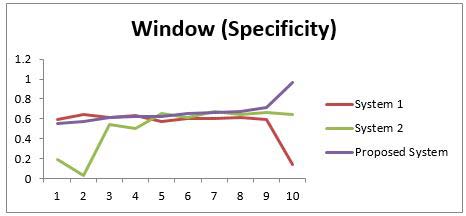
For monitoring the effect of specificity, we collect data and compare them and choose the better line. The Graph for Window (Accuracy):
Our system is heightening from system 1 and system 2 because it is a prosperous order line graph. From the table, we plot the value and choose a better system, and the implemented system is the best than others. The Graph for Window (G-mean):
We are measuring and plotting the value for the diagram and observe that it is increasing. In modern time almost, people prefer to do their work digitally, so they use the internet to do that work. Through the internet, we connect with those equipments easily which we used in our daily life for controlling that thing. With the help of IoT and the Internet, we can do those activity [24]. We can control and monitor our home equipment when the owner goes outside. For this purpose, this system needs to response in less time because if the materials turn on a long time, it will damage, or its cases more electric bill. We try to remove that problem in our paper. In future, we develop this system for consuming time on demand [25,26].
V.
15. Result
In this system, we calculate the time for seven equipment, and here we give four equipment's (light, fan, door, window) real-time in-home automation system. In our next paper, we will discuss and calculate the time for other three equipment. We passed data packet through every device for ten different ways. Collecting values and plotting those for creating a graph that helps us to view real-time response. We excrement for measuring a mediocre period and comparing with other existing systems. From the diagram, we see that our systems Sensitivity, Specificity, Precision, Accuracy, F1-score, and G-mean provide a better graph line than others. And we see that our systems response is better than another system.
16. VI.
17. Conclusion
IoT promotes the proficiency of existence by joining the digital world to the real world via setting different sensors in daily life objects [27]. If we utilize our system correctly, we save our valuable time, energy; electric power moreover comforts of life. This work may be expanded to additional provision from other networks as those rules may provide better insight into the conduct [28].

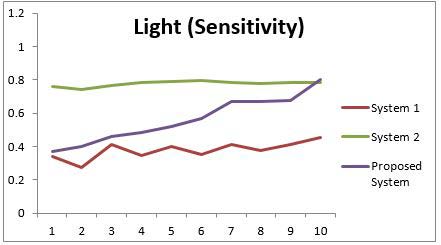


![Fig. 27: Light (Sensitivity) c) Future WorkIn modern time almost, people prefer to do their work digitally, so they use the internet to do that work. Through the internet, we connect with those equipments easily which we used in our daily life for controlling that thing. With the help of IoT and the Internet, we can do those activity[24]. We can control and monitor our home equipment when the owner goes outside. For this purpose, this system needs to response in less time because if the materials turn on a long time, it will damage, or its cases more electric bill. We try to remove that problem in our paper. In future, we develop this system for consuming time on demand[25,26].](image-28.png)
| Equipment to | Server to | |
| Server | Equipment | |
| Equipment to Server | Passing Time(x) | Obstacle Time(x') |
| Server to Equipment | Obstacle Time(y') | Passing Time(y) |
| Light | |||
| System 1 | System 2 | Proposed System | |
| 0.339 | 0.759 | 0.368 | |
| 0.273 | 0.740 | 0.398 | |
| 0.412 | 0.766 | 0.461 | |
| 0.349 | 0.783 | 0.484 | |
| Sensitivity | 0.402 0.353 | 0.793 0.799 | 0.518 0.571 |
| 0.414 | 0.786 | 0.671 | |
| 0.374 | 0.776 | 0.669 | |
| 0.414 | 0.782 | 0.679 | |
| 0.452 | 0.787 | 0.805 |
| Light | |||
| System 1 | System 2 | Proposed System | |
| 0.467 | 0.692 | 0.394 | |
| 0.293 | 0.705 | 0.421 | |
| 0.388 | 0.789 | 0.519 | |
| 0.446 | 0.710 | 0.538 | |
| Specificity | 0.493 0.457 | 0.719 0.712 | 0.541 0.597 |
| 0.475 | 0.697 | 0.669 | |
| 0.503 | 0.687 | 0.681 | |
| 0.525 | 0.668 | 0.721 | |
| 0.503 | 0.673 | 0.881 |
| Light | |||
| System 1 | System 2 | Proposed System | |
| 0.437 | 0.743 | 0.479 | |
| 0.266 | 0.727 | 0.503 | |
| 0.373 | 0.761 | 0.530 | |
| 0.332 | 0.720 | 0.532 | |
| Precision | 0.409 0.377 | 0.727 0.718 | 0.539 0.554 |
| 0.411 | 0.703 | 0.558 | |
| 0.395 | 0.692 | 0.575 | |
| 0.435 | 0.673 | 0.622 | |
| 0.459 | 0.677 | 0.708 |
| Light | |||
| System 1 | System 2 | Proposed System | |
| 0.397 | 0.729 | 0.499 | |
| 0.284 | 0.723 | 0.500 | |
| 0.399 | 0.758 | 0.528 | |
| 0.403 | 0.746 | 0.537 | |
| Accuracy | 0.450 0.407 | 0.755 0.754 | 0.551 0.576 |
| 0.447 | 0.739 | 0.585 | |
| 0.443 | 0.729 | 0.625 | |
| 0.473 | 0.721 | 0.669 | |
| 0.478 | 0.726 | 0.821 |
| Light | |||
| System 1 | System 2 | Proposed System | |
| 0.382 | 0.751 | 0.417 | |
| 0.269 | 0.734 | 0.456 | |
| 0.391 | 0.764 | 0.493 | |
| 0.340 | 0.750 | 0.517 | |
| F1-score | 0.406 0.365 | 0.758 0.757 | 0.529 0.573 |
| 0.413 | 0.742 | 0.575 | |
| 0.384 | 0.731 | 0.609 | |
| 0.424 | 0.723 | 0.693 | |
| 0.455 | 0.728 | 0.702 |
| Light | |||
| System 1 | System 2 | Proposed System | |
| 0.898 | 1.205 | 0.982 | |
| 0.752 | 1.202 | 1.001 | |
| 0.894 | 1.247 | 1.028 | |
| 0.892 | 1.222 | 1.033 | |
| G-mean | 0.946 0.900 | 1.229 1.229 | 1.044 1.044 |
| 0.943 | 1.218 | 1.069 | |
| 0.936 | 1.209 | 1.126 | |
| 0.969 | 1.204 | 1.160 | |
| 0.977 | 1.208 | 1.249 |
| Fan | |||
| System 1 | System 2 | Proposed System | |
| 0.497 | 0.425 | 0.218 | |
| 0.524 | 0.798 | 0.232 | |
| 0.558 | 0.825 | 0.243 | |
| 0.586 | 0.867 | 0.248 | |
| Sensitivity | 0.579 0.576 | 0.779 0.791 | 0.252 0.255 |
| 0.566 | 0.762 | 0.264 | |
| 0.570 | 0.775 | 0.283 | |
| 0.569 | 0.752 | 0.375 | |
| 0.555 | 0.764 | 0.454 |
| Fan | |||
| System 1 | System 2 | Proposed System | |
| 0.323 | 0.854 | 0.292 | |
| 0.491 | 0.752 | 0.334 | |
| 0.595 | 0.783 | 0.394 | |
| 0.496 | 0.736 | 0.437 | |
| Specificity | 0.523 0.571 | 0.767 0.762 | 0.499 0.527 |
| 0.579 | 0.777 | 0.572 | |
| 0.594 | 0.787 | 0.593 | |
| 0.573 | 0.765 | 0.648 | |
| 0.572 | 0.774 | 0.843 |
| Fan | |||
| System 1 | System 2 | Proposed System | |
| 0.545 | 0.392 | 0.271 | |
| 0.582 | 0.688 | 0.280 | |
| 0.552 | 0.752 | 0.287 | |
| 0.538 | 0.777 | 0.292 | |
| Precision | 0.555 0.597 | 0.745 0.789 | 0.305 0.348 |
| 0.601 | 0.760 | 0.357 | |
| 0.613 | 0.774 | 0.367 | |
| 0.577 | 0.751 | 0.389 | |
| 0.563 | 0.763 | 0.513 |
| Fan | |||
| System 1 | System 2 | Proposed System | |
| 0.431 | 0.777 | 0.268 | |
| 0.509 | 0.771 | 0.294 | |
| 0.528 | 0.802 | 0.315 | |
| 0.541 | 0.804 | 0.355 | |
| Accuracy | 0.552 0.573 | 0.773 0.778 | 0.374 0.389 |
| 0.572 | 0.769 | 0.453 | |
| 0.581 | 0.781 | 0.489 | |
| 0.571 | 0.758 | 0.503 | |
| 0.564 | 0.769 | 0.739 |
| Fan | |||
| System 1 | System 2 | Proposed System | |
| 0.520 | 0.408 | 0.242 | |
| 0.551 | 0.739 | 0.254 | |
| 0.555 | 0.787 | 0.263 | |
| 0.561 | 0.819 | 0.271 | |
| F1-score | 0.567 0.586 | 0.762 0.791 | 0.274 0.297 |
| 0.583 | 0.761 | 0.300 | |
| 0.591 | 0.774 | 0.319 | |
| 0.574 | 0.751 | 0.382 | |
| 0.559 | 0.764 | 0.481 |
| Fan | |||
| System 1 | System 2 | Proposed System | |
| 0.906 | 1.131 | 0.735 | |
| 1.007 | 1.245 | 0.773 | |
| 1.026 | 1.268 | 0.806 | |
| 1.040 | 1.266 | 0.849 | |
| G-mean | 1.049 1.071 | 1.243 1.246 | 0.852 0.863 |
| 1.070 | 1.241 | 0.914 | |
| 1.079 | 1.249 | 0.949 | |
| 1.069 | 1.232 | 0.973 | |
| 1.062 | 1.240 | 1.139 |
| Door | |||
| System 1 | System 2 | Proposed System | |
| 0.455 | 0.638 | 0.096 | |
| 0.522 | 0.542 | 0.236 | |
| 0.607 | 0.456 | 0.272 | |
| 0.612 | 0.628 | 0.289 | |
| Sensitivity | 0.615 0.578 | 0.704 0.739 | 0.298 0.304 |
| 0.555 | 0.761 | 0.309 | |
| 0.572 | 0.772 | 0.329 | |
| 0.552 | 0.781 | 0.357 | |
| 0.526 | 0.788 | 0.367 |
| Door | |||
| System 1 | System 2 | Proposed System | |
| 0.427 | 0.787 | 0.486 | |
| 0.446 | 0.820 | 0.554 | |
| 0.486 | 0.826 | 0.573 | |
| 0.463 | 0.789 | 0.615 | |
| Specificity | 0.492 0.495 | 0.773 0.805 | 0.619 0.644 |
| 0.536 | 0.759 | 0.649 | |
| 0.523 | 0.687 | 0.666 | |
| 0.520 | 0.762 | 0.737 | |
| 0.542 | 0.747 | 0.949 |
| Door | |||
| System 1 | System 2 | Proposed System | |
| 0.492 | 0.756 | 0.334 | |
| 0.467 | 0.589 | 0.334 | |
| 0.498 | 0.486 | 0.335 | |
| 0.473 | 0.588 | 0.335 | |
| Precision | 0.499 0.500 | 0.641 0.717 | 0.336 0.338 |
| 0.540 | 0.716 | 0.347 | |
| 0.527 | 0.646 | 0.365 | |
| 0.506 | 0.732 | 0.373 | |
| 0.508 | 0.745 | 0.391 |
| Door | |||
| System 1 | System 2 | Proposed System | |
| 0.443 | 0.713 | 0.399 | |
| 0.482 | 0.731 | 0.438 | |
| 0.541 | 0.728 | 0.465 | |
| 0.529 | 0.737 | 0.494 | |
| Accuracy | 0.547 0.534 | 0.748 0.779 | 0.496 0.515 |
| 0.545 | 0.760 | 0.542 | |
| 0.547 | 0.723 | 0.548 | |
| 0.535 | 0.771 | 0.555 | |
| 0.534 | 0.767 | 0.751 |
| Door | |||
| System 1 | System 2 | Proposed System | |
| 0.983 | 0.688 | 0.152 | |
| 0.493 | 0.565 | 0.278 | |
| 0.547 | 0.470 | 0.281 | |
| 0.533 | 0.607 | 0.310 | |
| F1-score | 0.551 0.536 | 0.671 0.728 | 0.315 0.319 |
| 0.548 | 0.738 | 0.321 | |
| 0.549 | 0.703 | 0.338 | |
| 0.528 | 0.756 | 0.363 | |
| 0.516 | 0.766 | 0.378 |
| Door | |||
| System 1 | System 2 | Proposed System | |
| 0.939 | 1.194 | 0.885 | |
| 0.984 | 1.167 | 0.918 | |
| 1.045 | 1.132 | 0.939 | |
| 1.036 | 1.190 | 0.957 | |
| G-mean | 1.052 1.035 | 1.215 1.243 | 0.959 0.986 |
| 1.045 | 1.233 | 0.989 | |
| 1.046 | 1.208 | 0.997 | |
| 1.035 | 1.242 | 1.008 | |
| 1.033 | 1.239 | 1.022 |
| Window | |||
| System 1 | System 2 | Proposed System | |
| 0.507 | 0.318 | 0.150 | |
| 0.554 | 0.805 | 0.244 | |
| 0.601 | 0.818 | 0.254 | |
| 0.622 | 0.757 | 0.256 | |
| Sensitivity | 0.622 0.587 | 0.781 0.742 | 0.283 0.303 |
| 0.584 | 0.763 | 0.317 | |
| 0.587 | 0.735 | 0.318 | |
| 0.584 | 0.753 | 0.322 | |
| 0.581 | 0.731 | 0.325 | |
| The Graph for Window (Sensitivity): | |||
| Window | |||
| System 1 | System 2 | Proposed System | |
| 0.594 | 0.187 | 0.549 | |
| 0.647 | 0.035 | 0.570 | |
| 0.614 | 0.541 | 0.617 | |
| 0.636 | 0.499 | 0.621 | |
| Specificity | 0.576 0.607 | 0.655 0.615 | 0.622 0.649 |
| 0.599 | 0.673 | 0.662 | |
| 0.611 | 0.645 | 0.677 | |
| 0.598 | 0.661 | 0.716 | |
| 0.141 | 0.639 | 0.969 | |
| Window | |||
| System 1 | System 2 | Proposed System | |
| 0.601 | 0.276 | 0.249 | |
| 0.650 | 0.690 | 0.258 | |
| 0.616 | 0.702 | 0.259 | |
| 0.638 | 0.666 | 0.288 | |
| Precision | 0.577 0.608 | 0.740 0.706 | 0.325 0.334 |
| 0.600 | 0.734 | 0.334 | |
| 0.612 | 0.708 | 0.334 | |
| 0.599 | 0.709 | 0.334 | |
| 0.607 | 0.689 | 0.339 |
| Window | |||
| System 1 | System 2 | Proposed System | |
| 0.209 | 0.252 | 0.468 | |
| 0.597 | 0.595 | 0.498 | |
| 0.607 | 0.699 | 0.502 | |
| 0.629 | 0.646 | 0.507 | |
| Accuracy | 0.598 0.597 | 0.725 0.686 | 0.519 0.546 |
| 0.591 | 0.722 | 0.547 | |
| 0.599 | 0.694 | 0.548 | |
| 0.591 | 0.709 | 0.585 | |
| 0.447 | 0.687 | 0.894 | |
| Window | |||
| System 1 | System 2 | Proposed System | |
| 0.549 | 0.296 | 0.247 | |
| 0.598 | 0.743 | 0.254 | |
| 0.608 | 0.755 | 0.256 | |
| 0.629 | 0.709 | 0.257 | |
| F1-score | 0.599 0.596 | 0.399 0.723 | 0.286 0.318 |
| 0.592 | 0.748 | 0.321 | |
| 0.599 | 0.721 | 0.325 | |
| 0.591 | 0.730 | 0.328 | |
| 0.594 | 0.709 | 0.329 | |
| Window | |||
| System 1 | System 2 | Proposed System | |
| 1.049 | 0.711 | 0.935 | |
| 1.095 | 0.917 | 0.937 | |
| 1.102 | 1.166 | 0.942 | |
| 1.122 | 1.121 | 0.945 | |
| G-mean | 1.095 1.092 | 1.198 1.165 | 0.951 0.965 |
| 1.088 | 1.198 | 0.969 | |
| 1.095 | 1.175 | 0.989 | |
| 1.087 | 1.189 | 1.009 | |
| 1.849 | 1.170 | 1.058 |